Dynamic pricing and the PAO framework
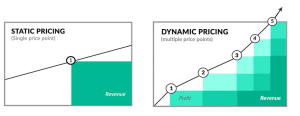
Dynamic pricing is one of the most interesting application of data science. Using dynamic pricing you can find out the best price for a product or service by using historical data of past purchases. Dynamic pricing has a long history, starting with airlines. The internet and smart phones have unlocked massive opportunities for personalisation. Dynamic pricing is, by far, one of the best ways to use to data to increase margins, and maximise profits for any B2C business.
In the past I have also talked about the Predict And Optimise (PAO) framework. You can learn more about the differences between optimisation and prediction below, but here is a short summary:
-
- Build a predictive model for a single variable that you care about maximising (or minimising).
- Use an optimisation method to reverse engineer the model and figure out the best possible values to produce the optimal result.
So, how can you apply this in dynamic pricing? It’s a simple two-step process.
- Prediction step: Build a predictive model, that predicts any of the following (or a similar variable):
-
- Whether someone will purchase a product.
- The total profit from a product.
- Optimisation step: Use an optimisation algorithm, in order to find the optimal values for a product (or customer) so that the target variable would be optimised.
Dynamic pricing in practice
I decided to build an R Shiny dashboard to demonstrate how this framework could be used in practice. This dashboard is based on this dataset, which is a processed version of a dataset that can be found on Kaggle.
So, how does the dashboard work? Here is a detailed list of instructions:
Step 1: Upload a dataset
The dataset should contain individual transactions. Each row can contain both user and product information.
Step 2: Load the dataset
Click on “Load data” to load the dataset. This step will also parses the “Date” variable using the “date format” specification. This specification abides by the lubridate package. So, how does this work in practice? The default setting is ‘mdY HM’. This means ‘month, day, year in a format like 2019, then hour and minute’. So, for example, 01/01/2019 23:41 is valid, as well as, 01/23/2018 20:42.
If year is in a 2 digit format (e.g. 19), then use mdy. If the variable also contained seconds, then we should have written mdY HMS.
If all this is confusing, then simply try to mimic the date format followed in the demo dataset.
Step 3: Choose the target variable
What variable are you trying to maximise? In this case it is the gross margin.
Step 4: Choose any constraints
If the dataset contains categorical variables (e.g. gender), then you can set rules that “freeze” the values of these variables. The default settings are Branch=A,Gender=Male. This means that we want to find the best products for Males that will visit supermarket A.
Step 5: Fit the model.
This will fit a random forest model on the data, and display the quality of the fit. The quality of the fit is also measured by the correlation between predict and real values. Step 5 might take a while, especially if you have a big dataset.
Step 6: Optimise
This step runs a genetic algorithm to find the best values in order to optimise the target variable. Choose the total number of iterations from the slider above. Higher values (above 50) might take a long time to complete.
If you’ve done everything right, then you should see something like the following screen:
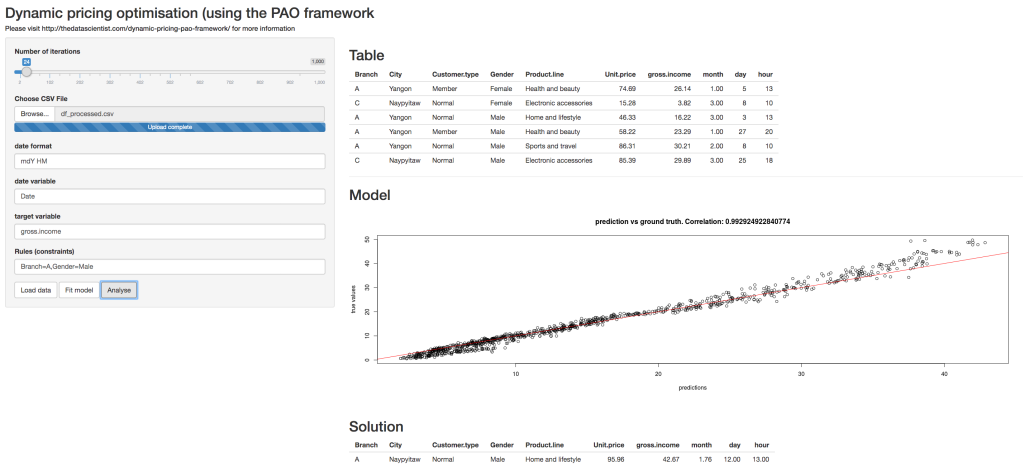
In this example, you can see that for a Male that is visiting branch A, then a good product would be a product in the “Home and lifestyle” category, sold around January-February, on the first half of the month, in the afternoon at a price of 95-96.
Comments about the script
This script is a demonstration of how easy it is to run a dynamic pricing model. A few things might seem confusing to those who are new in data science. However, this is a demonstration and not a fully-fledged product. A few notes:
- The script will not work if you don’t have a date variable.
- There is currently no option to restrict price ranges.
- There are other ways to run dynamic pricing (e.g. predict whether someone will make a purchase or not)
- This script is using a random forest algorithm, but there are many other choices of algorithms.
If you are interested to learn more about how you could use dynamic pricing in your business or organisation, then make sure to get in touch to learn more about my services. Also, if you are a decision maker or an entrepreneur make sure to check out The Tesseract Academy‘s workshops, where you can learn more about how you can use data science in your company.