Data science has been a buzzword in the business world for some time now, and with good reason. Data science is a valuable method for businesses looking to gain insights into their customer base, market trends, and other predictive analytics. It can also drive operational efficiencies and cost savings – all of which can help a business succeed.
When it comes to mastering the art of data science, statistics is an essential component of the equation. From drawing relationships between variables to predicting future outcomes, statistics can be applied to a broad range of data-related tasks. For data scientists, it’s crucial to have a solid understanding of advanced statistical concepts to analyze data better and make more accurate predictions.
Data science is becoming increasingly popular in today’s world, and it’s no wonder why. Businesses are utilizing data-driven insights to understand their markets better and target specific audiences. With the immense amount of data generated daily, advanced statistics has become an invaluable subject in supporting data science initiatives. But what exactly is advanced statistics? Let’s dive in and find out.
What is Advanced Statistics in Data Science?
Advanced statistics can be defined as the use of statistical methods and concepts, such as probability distributions, hypothesis testing, regression analysis, etc., to analyze data and develop models that can make predictions, comparisons, and decisions.
Advanced statistics is an essential component of the data science landscape. It involves statistical methods and concepts, along with machine learning algorithms, to interpret data, identify correlations, and make predictions. Advanced statistics enables businesses to make informed decisions and gain invaluable insights into their markets. As data science continues to grow and evolve, so too will the importance of advanced statistics.
Data science is an ever-evolving field, and by staying ahead of the curve, data scientists can ensure that their businesses are making the most of their data. Leveraging advanced statistics concepts through books and tutorials or pursuing a professional data science course can help data scientists stay one step ahead of the competition.
In order to make the most of this broad subject, data scientists need to understand the most advanced statistics concepts.
5 Advanced Statistics Topics for Data Scientists
Here, we’ll take a look at five advanced statistics topics that data scientists need to master in order to perform their jobs effectively and help organizations make better decisions:
1. Probability Distributions
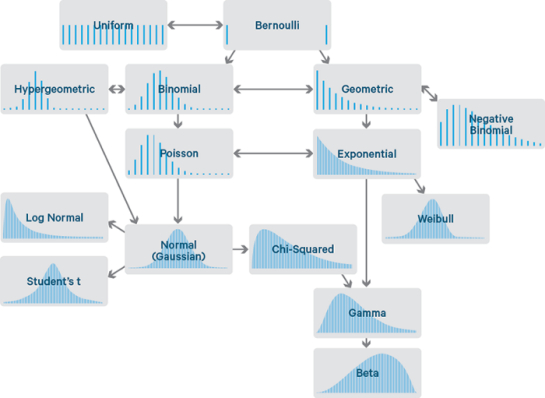
Probability distributions play a significant role in understanding the relationships between random variables and predicting the outcomes of different processes. One of the primary purposes of a probability distribution is to provide insight into the relationships between random variables. By examining the shape of a particular distribution, we can determine whether a specific set of values is more likely than another set. It can help us predict the likelihood of a specific outcome occurring based on given data.
Another use of probability distributions in data science is determining the range of possible values within a given data set. By analyzing the shape of the probability distribution, we can determine the minimum and maximum values that are likely to occur. We can also use this to estimate the probability of different values appearing in a set of data.
Furthermore, probability distributions are used in advanced statistics to test hypotheses. By comparing different data sets, we can conclude the likelihood of a particular result based on the available data. It can be used to test hypotheses and theories in various fields of research.
2. Hypothesis Testing
Hypothesis testing is a powerful statistical method used to make judgments from which the sample data was taken. It helps researchers determine whether the observed data is what would be expected under certain conditions and helps identify any issues or trends in the data.
Hypothesis testing is used to evaluate theories and confirm the validity of data. It’s a powerful technique that enables us to draw meaningful insights from data and make more informed decisions. As a result, understanding hypothesis testing is essential for any aspiring data scientist. By utilizing this technique in data science, companies and businesses can better understand their data and make informed decisions.
3. Analysis of Variance (ANOVA)
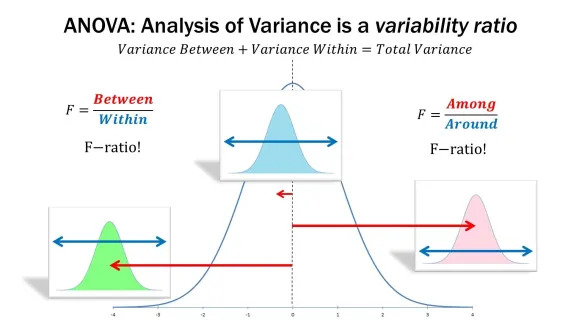
ANOVA is a statistical technique that measures the variation among data sets and determines the differences between a pair of observations. ANOVA is commonly used in advanced statistics for data science as it allows researchers to identify the differences between two or more sets of data.
When using ANOVA in data science, it is essential to ensure that the data is collected in a valid and reliable manner. It means that the data should be collected and analyzed in accordance with the scientific method. ANOVA helps explore the relationships between variables and determine how much of the variation in the data is due to random or systematic effects.
Once the data has been collected in an appropriate manner, ANOVA can be used to compare the means of different data sets. This comparison can be used to determine if there is any significant difference between the means or groups. Therefore, it is an invaluable technique that all data scientists should master.
4. Regression Analysis
Regression analysis is one of the most commonly used advanced statistical methods for data analysis. It is used to analyze relationships between different variables, such as the effect of one variable on another.
Regression analysis is a powerful technique for data analysis. It works well when there is a linear relationship between the variables being studied. It is also useful when there are multiple dependent or independent variables or complex relationships between them. Additionally, the results from regression analysis can identify patterns in data and determine which factors are most important for predicting a particular outcome.
By understanding these relationships, you can make more accurate predictions, better understand your data, make better decisions, and create more reliable data-driven solutions. Machine learning techniques involved in regression analysis include linear regression, multiple linear, and non-linear regression.
5. Dimensionality Reduction Techniques
Dimensionality reduction is a process that reduces a data set’s “dimensionality” or the number of features it has. The process is done by identifying those features that are either redundant or less important in relation to the others. By reducing the dimensionality of a data set, the complexity of the machine learning algorithms that are used to analyze it can be significantly reduced, allowing for more efficient and accurate analysis.
There are several techniques used for dimensionality reduction. For example, Principal Component Analysis (PCA) is a popular technique used to reduce the dimensionality of a dataset by taking a linear combination of its features to form new, uncorrelated variables. This method is beneficial for removing multicollinearity between variables, which can often lead to inaccurate predictions in machine learning tasks.
Dimensionality reduction is also used in various applications, such as clustering, anomaly detection, and natural language processing (NLP). In clustering, for example, reducing the dimensionality of the data makes it easier for the algorithm to group similar observations together. For anomaly detection, reducing the dimensionality of the data makes it easier to identify unusual observations which may indicate fraudulent activities. And in NLP, reducing the dimensionality of the data helps to capture the semantic meaning of words, allowing for a more accurate understanding of natural language.
Summing Up
By understanding these five advanced statistical concepts, data scientists can make the most of the data at their disposal. Probability distributions, hypothesis testing, ANOVA, regression analysis, and dimensionality reduction techniques are all essential concepts for data scientists, and understanding how to leverage them can be the difference between success and failure.
No matter what field of data science you’re in, having a solid understanding of these five advanced statistics concepts can help make you a more effective data scientist.
Now the question arises – How can you learn these concepts?
Well, you can enroll in the top-notch pg program in data science and business analytics which is designed by the University of Texas at Austin (UT Austin) and Great Learning. The program prepares you to become business-ready data scientists and business analysts through hands-on experiential learning of industry-relevant tools and techniques.
By mastering these concepts, data scientists can uncover more profound insights into data and make more accurate predictions. As the world of data science continues to evolve, these advanced statistical concepts will be increasingly important for data scientists to understand.