
As the statistician Hadley Wickham has said, “The goal of a good data scientist is to make complex ideas simple, not to make simple ideas complex.” Clarity and simplicity of presentation are essential in academic writing in data science, where the objective is to share sophisticated analyses in ways that keep the reader engaged while making the results clear and credible. Data science lies at the intersection of statistics, analytics, and machine learning, and in its present context, the “big data” component includes written communications. This article contains top tools and techniques that help students and pros in data science write papers with insight and impact, turning big data into understandable insights for an audience.
Utilizing Python for Data Analysis
Python isn’t just a programming language. It’s a powerful tool for manipulating and analyzing data science via libraries such as Pandas for data wrangling, statistics, and structure, NumPy for numerical data, and Matplotlib for data visualization. It means that writers can process and analyze data quickly, produce figures and tables, and be confident that their insights are based on correct computations and clean data.
Students and professionals often turn to expert writing services to hire a professional writer who can make high-quality papers adhering to any citation style. If you are worried about “Who can write my APA paper?” the TopEssayWriting authors can assist in structuring, editing, and refining academic documents. Integrate the proper data science tools and techniques with the expertise of expert writers to ensure you communicate complex data analyses effectively.
R for Statistical Computing
R has a robust ecosystem of statistical and graphical models that handle the more advanced cases of papers involving complex statistical methods and interactive applications. For example, authors can package studies using the tools ggplot2 for advanced plots, dplyr for data manipulation, and shiny for interactive web apps – all the while creating high-quality graphs and models for their papers for a more understandable final product.
Jupyter Notebooks for Collaborative Writing
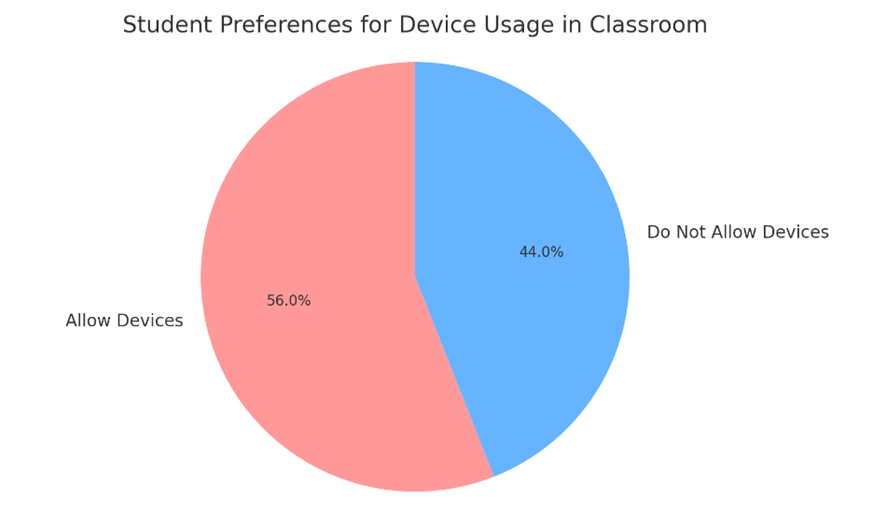
Using digital learning tools for studying is highly beneficial for learners. It’s reported that 56% of students desire that educators permit them to use devices in the classroom.
So, there’s no wonder that Jupyter Notebooks can easily fit into the interests of those writing data-rich texts. It provides a single environment that blends different everyday computational tasks, such as:
- Seamless Integration: Combines code, output, visualizations, and text in one place.
- Draft Writing Excellence: Accurately utilizes data inspection in executing tasks with descriptive analysis; the narrative is tightly aligned to and derived from data insights.
- Formatting Flexibility: Supports Markdown for easy formatting and LaTeX for advanced scientific typesetting.
- Publication Readiness: Facilitates the creation of content-rich, publication-ready scientific documents.
These features help smooth the transition from dirty data exploration to well-produced output – growth in productivity and polish together in scientific documentation.
Tableau for Interactive Data Visualization
You can use Tableau to create interactive, shareable visualizations to embed them directly into a paper rather than simply displaying a static chart or table. In this way, a data-laden paper can be made “alive” for a reader – allowing them to read about your analysis and interact with the data as they read it. For particularly complex analyses, interactivity can be a compelling way to take the reader’s experience from good to excellent. Moreover, incorporating task automation tools can significantly streamline the writing process. Data science automation can manage data more effectively – from cleaning to analyzing and beyond – so writers can focus on narrative aspects.
Techniques for Clear and Effective Writing
There are other techniques beyond tools. It’s helpful to structure your paper so readers can intuit the flow, from introduction to conclusion. Each section must explicitly express what was analyzed, what the reader can expect, and what it uncovered. Contextualizing the methodology before the results or summarising critical findings at the top of sections helps.
Harnessing Tools for Enhanced Clarity and Insight
| Python | Libraries like Pandas, NumPy, and Matplotlib are ideal for data manipulation visualization and precise data analysis. |
| R | Statistically oriented, with packages such as ggplot2 and dplyr, great for computational statistics and interactive visualizations. |
| Jupyter Notebooks | It combines text, codes, outputs, and visualizations, supports Markdown and LaTeX, and is ideal for drafting and data-intensive analysis. |
| Tableau | Builds interactive, shareable visualizations; enhances data exploration and reader engagement within papers. |
| Writing Techniques | Always use clear structuring, logical flow, upfront summaries, a detailed discussion of methods, and clear messages. |
When tools like data science, Python, and R are incorporated into writing to turn big data into paper findings, your work’s analytic rigor is arguably much enhanced. Still, your conclusions are also communicated more effectively. Data science analyses become more effectively presented by elaborating on data analysis with Python and R, narrative and data with Jupyter Notebooks, and presentations of findings with different visualization types (such as static, interactive, or even dynamic visualizations) in Tableau. The goal is to ensure your insights are reported with greater clarity and precision and that your scientific community learns more from your research findings.