What: This article highlights the importance of significance level, confidence level, and confidence interval in drawing conclusions and making informed decisions while working with data.
Why: This article aims to help readers understand the differences and connections between these concepts and how they can be used to make informed decisions while working with data.
Source: Pixabay
If you are working with data, it is crucial to consider the data’s quality, precision, and reliability. The significance level, confidence level, and confidence interval are fundamental concepts that play a vital role in drawing conclusions and making informed decisions. While using sample data in statistics, hypothesis testing is essential. Drawing inferences from sample data may not always represent the whole population. There are basically two types of hypotheses and errors during data interpretation:
- Null Hypothesis
- Alternative Hypothesis
The null hypothesis states no relationship between the variables, whereas the alternative hypothesis states a significant relationship between the variables in a data set. There are two types of errors associated with hypothesis testing. The two types of errors are related to drawing an incorrect conclusion. Type I error, generally known as false positives, rejects a null hypothesis that is true. On the other hand, Type II error, generally known as false negative, fails to reject a null hypothesis that is false. In this article, we will look at the differences between significance level, confidence level, and confidence interval. And how these concepts help in improving the accuracy of the data and the results.
Level of Significance
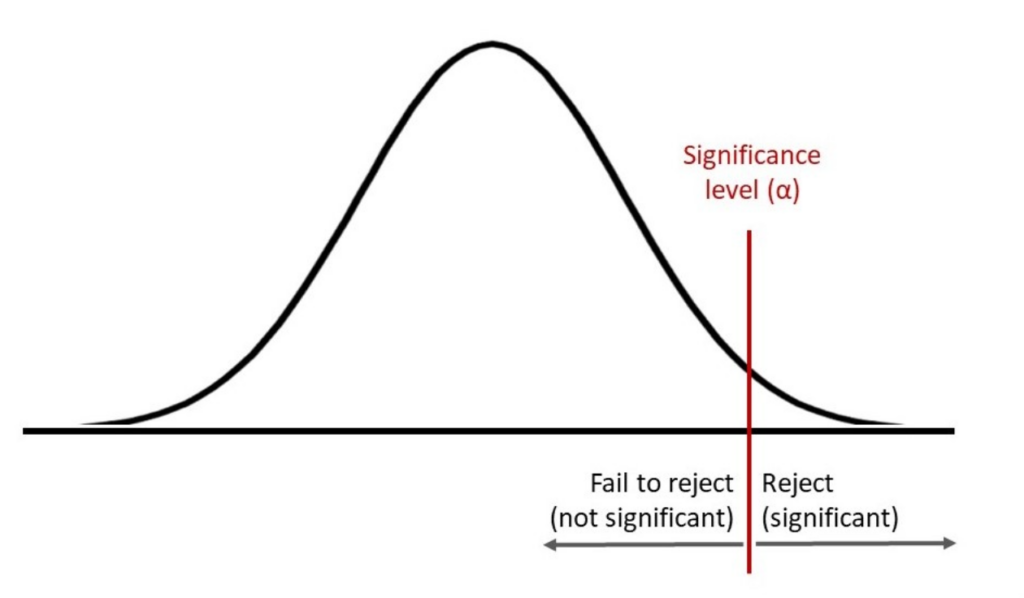
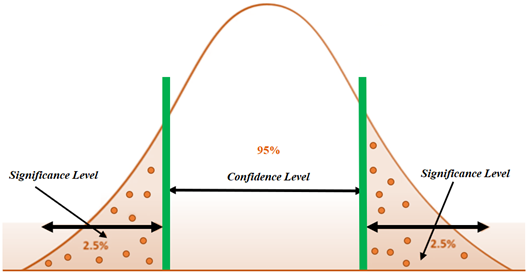
In general terms, the level of significance (significance level, or alpha) measures the evidence present in your sample so that you can accurately reject the null hypothesis. A null hypothesis occurs when both possibilities or outcomes are the same. A significance level is used to determine if the null hypothesis is true or not. If the significance level is low, it may indicate a lack of evidence for rejecting the null hypothesis.
Confidence Level
The confidence level, on the other hand, indicates the probability of obtaining the same results if you repeat the same data collection processes like tests, polls, or surveys. The confidence level is established before conducting the data integration and collection, typically between 90% and 99%. It helps you determine whether the results from sample data apply to the entire population.
Confidence Interval
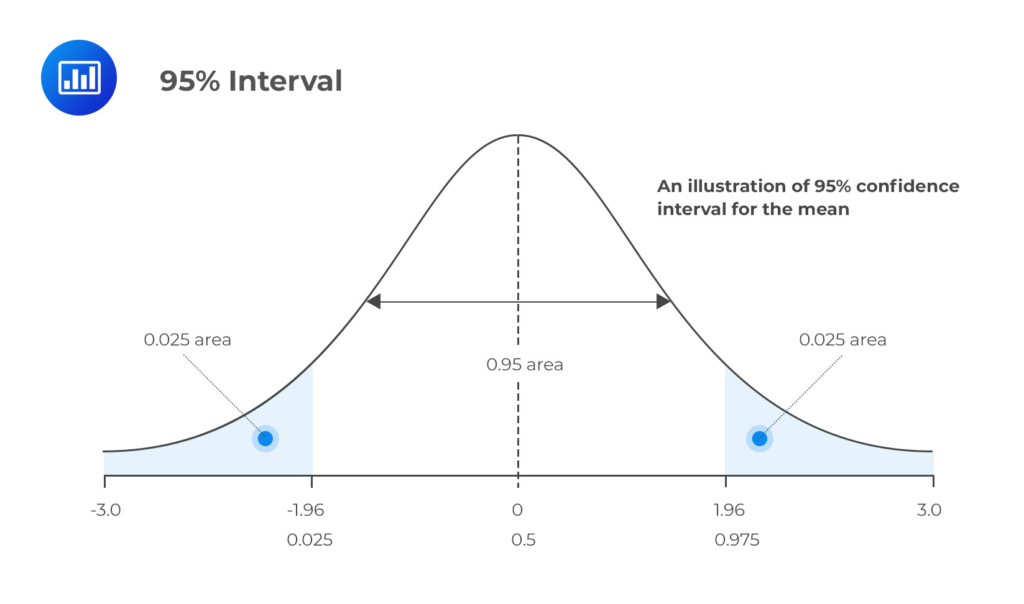
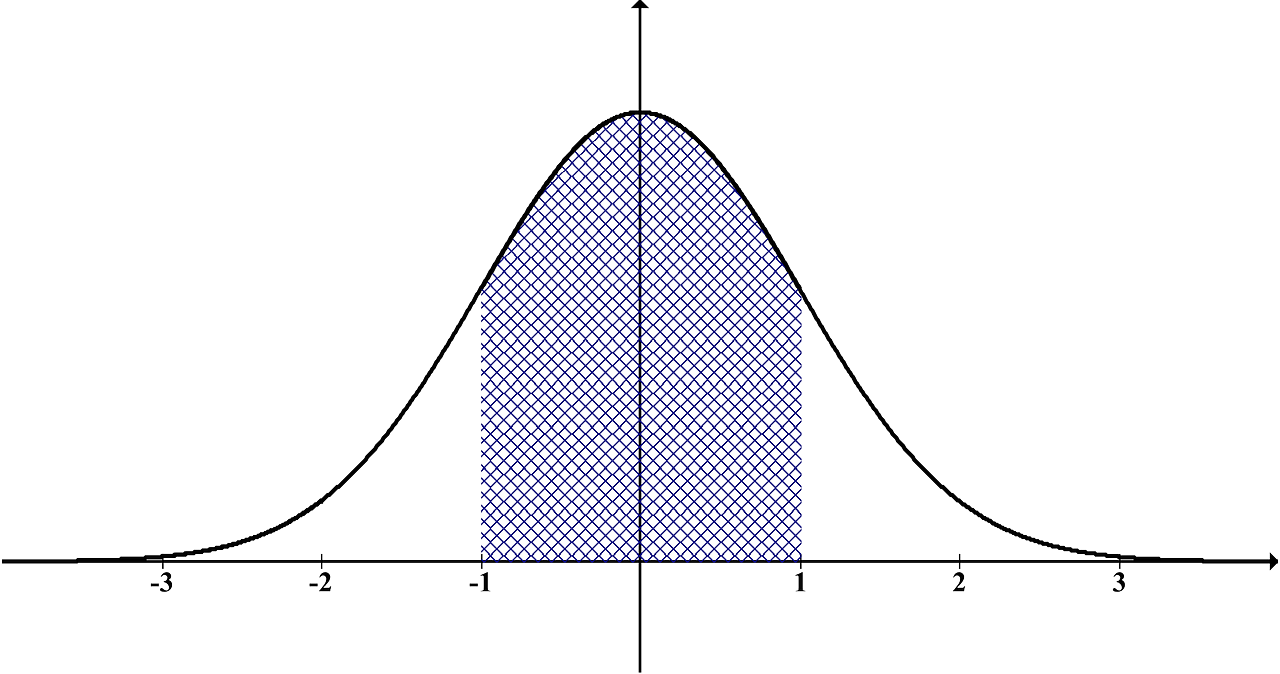
The confidence interval is a range of results that summarizes a data set or sample through statistical evidence like the mean, median, and standard deviation. Both confidence level and significance level are used to determine the confidence interval; however, the confidence level is taken into consideration to calculate the interval.
Key Differences and Comparisons
The fundamentals of these concepts in statistics have been examined. These ideas are all closely related to one another and are often used in data analysis and interpretation. An overview of the major differences between these concepts is given here.
Significance Level vs. Confidence Level
The significance level is the probability of a Type I error, i.e., rejecting a null hypothesis that is true. On the other hand, the confidence level indicates the probability of drawing accurate conclusions based on sample data. The significance level is a concept that deals with testing a hypothesis and avoiding a type I error, while the confidence level deals more with the precision of the results despite the repetition of the test. These two concepts have an inverse relationship, meaning that if the significance level increases, the confidence level decreases, and vice versa. If you want to be more certain of the conclusions you draw, your confidence level needs to be higher.
Mathematically,
Confidence level = 1-Significance level
Confidence Level vs Confidence Interval
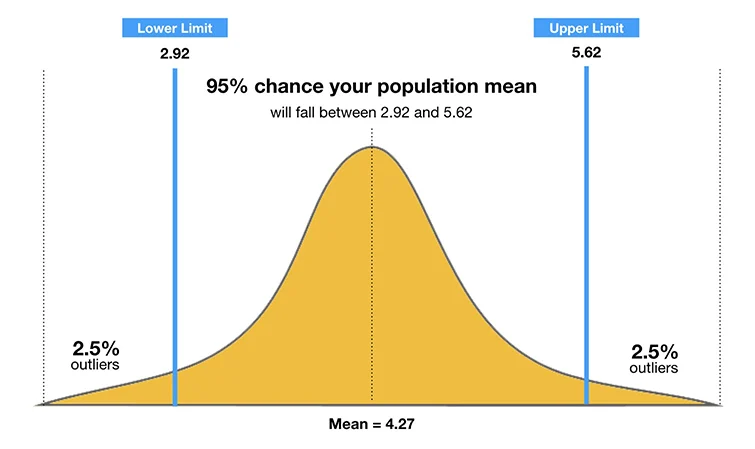
The confidence level and the width of the confidence interval are directly related. A higher confidence level widens the interval, making your estimate less precise. In contrast, a lower confidence level narrows the interval, making a more precise estimate.
Let us take an example of a result reported as 50 ± 6 with a 95% confidence level. The confidence interval for this particular example will be 44 to 60. The confidence level of 95% indicates that when repeating a survey 100 times, you expect it to be 95 times the same. You can also conclude that the true value is between 44 and 60, and 95% of the time the results will be the same.
Significance Level vs Confidence Interval
The significance level and confidence interval serve distinct purposes. The level of significance is important for decision-making during hypothesis testing and reducing Type I errors, where the confidence interval provides you with a range to determine where your actual value lies. These two concepts are equally important for different stages of data analysis.
Calculating Statistical Significance
- Create a null hypothesis
- Create an alternate hypothesis
- Determine the significance level and confidence level
- Calculate the standard deviation
- Calculate the standard error
- Calculate the t-score and use the t-table to determine the statistical significance.
Calculating Confidence Interval
- Find the sample mean
- Calculate the standard deviation
- Find the standard error and margin of error
- Find the confidence interval
Conclusion
In the world of statistics and data analysis, understanding the differences and connections between significance level, confidence level, and confidence interval is essential for making informed decisions. Significance level guides the rigor of hypothesis testing, while confidence level and interval help us estimate population parameters with a certain level of certainty. These tools empower researchers and decision-makers to draw meaningful conclusions from data, promoting accuracy and reliability in various fields.
At The Data Scientist, we aim to transform businesses through the power of AI, train students to become data scientists and pursue a career in AI, and specialize in designing and auditing token economies for Web 3.0. For more informative blogs like this visit our blog page.
FAQs
- What are Type I and Type II errors?
A type I error (false-positive) occurs if an investigator rejects a null hypothesis that is actually true in the population; a type II error (false-negative) occurs if the investigator fails to reject a null hypothesis that is actually false in the population.
- What are standard errors and margin of error?
A margin of error is a statistical measure that accounts for the degree of error received from the outcome of your research sample. On the other hand, standard error measures the accuracy of the representation of the population sample to the mean using the standard deviation of the data set.
- What are the t-score and t-table?
A t-table is a reference statistical table that contains critical values of the t-distribution, also known as the t-score or t-value. The t value explains the significance threshold for specific tests in statistics and the upper or lower confines of confidence intervals for explicit estimates.
- Why is it important to choose appropriate significance and confidence levels?
Choosing the right levels is critical to making informed decisions and avoiding costly errors in various fields, including research, medicine, and business.
- What is a p-value?
In statistics, the p-value is the probability of obtaining results at least as extreme as the observed results of a statistical hypothesis test, assuming that the null hypothesis is correct. The p-value serves as an alternative to rejection points to provide the smallest level of significance at which the null hypothesis would be rejected. A smaller p-value means that there is stronger evidence in favor of the alternative hypothesis.