In a fast-paced commercial world driven by data, effective data visualization tools have become indispensable assets. The ability to succinctly visualize large volumes of complex data enhances decision-making processes at all levels of a business. In this article, we will focus on one specific data visualization tool that is positively disruptive in sales performance management: the funnel chart. Keep reading to learn more.
Understanding the Concept of Data Visualization
Data visualization involves using graphical representations to make complex data easily understandable. It’s like telling a vivid, compelling story using the language of charts, graphs, maps, and infographics—the human brain processes visual information far more easily than text and numbers. By transforming raw data into visual content, businesses can communicate information more quickly and effectively.
Effective data visualization simplifies complex datasets and reveals patterns, trends, and correlations that may not be easily noticed in text-based data. This makes it a powerful tool for data analysts and business decision-makers. However, the choice of the visualization tool greatly influences the overall impact of the represented data.
There are many tools for data visualization each with unique features and benefits. One such tool, which is popularly used in sales and marketing, is the funnel chart.
Funnel charts are among the simplest yet most powerful visualization tools in business. They exhibit data linearly while considering the different stages of a process. This provides a comprehensive view of the data in question and allows for insightful quantitative analysis.
Funnel Charts as a Prime Tool in Sales Data Visualization
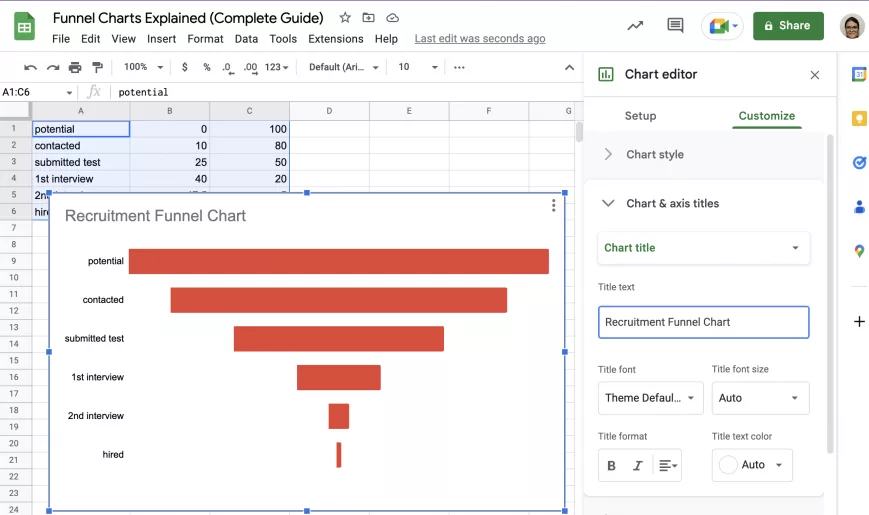
Funnel charts are commonly used to represent sales data. The funnel shape lucidly provides a metaphorical representation of lead conversion—from the top of the funnel, where all the prospects enter, to the bottom, where the deals are closed. The different stages of the sales process can be broken down and represented by each section of the funnel.
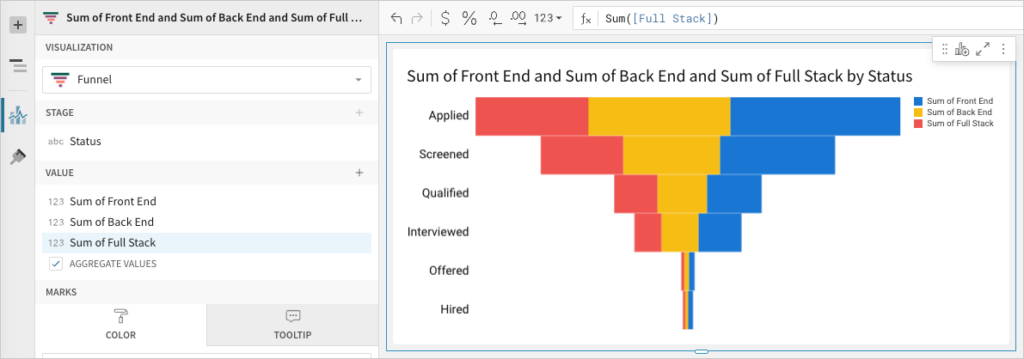
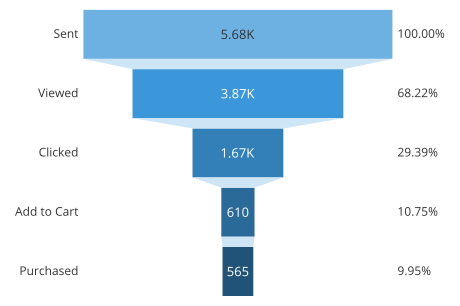
For businesses, funnel charts can be instrumental in spotting potential problem areas, such as drop-offs in the sales process. This can be invaluable for sales strategies by helping identify where prospects are being lost in the funnel and where to focus more effort to maximize conversion rates.
One of the key advantages of funnel charts is their simplicity. They allow viewers to see the progression of data in a clear, linear process, making it remarkably easy to interpret. This simplifies the decision-making process as well since critical decisions can be made based on easy-to-understand data.
Beyond sales, funnel charts can also be used to monitor website visitors, measure machine system loss, visualize project management processes, etc. However, their application in sales has always stood out, marking them as vital tools in sales data visualization.
Future Prospects of Funnel Charts in Sales and Marketing

Considering funnel charts’ immense utility and success, their role in business is bound to grow. With an increasing emphasis on data-driven decision-making in the world of business, the demand for efficient data visualization tools such as funnel charts will likely continue to rise.
As technology advances, we should anticipate more sophisticated versions of funnel charts. Enhanced interactivity and real-time intuitive capabilities are prospective areas of improvement. This can allow for instantaneous understanding and interpretation of sales data, further improving the speed and efficiency of decision-making processes.
Data blending with funnel charts can present another innovative approach to tackling complex sales data. Data blending involves integrating data from different sources and presenting it on a single platform. As more businesses adopt multi-channel sales strategies, such data blending can be essential to achieve a unified view of overall sales performance.
Funnel charts are set for greater heights. As businesses advance into big data and analytics, funnel charts will be more critical in making sense of complex data and improving overall business performance.